Run & share your Python code online with Jupyter notebooks

If you’ve had a look on previous posts on our Python SDK, you have a already a pretty good idea about scripts you can run against PMA.start (or PMA.core) for retrieving image data, Slide visualization

Most of the times running code locally is all what’s needed, however there are situations where being able to run it online and share it with collaborators (students, colleagues…) on the other side of the globe can come very handy and offer a richer and more interactive experience.
There are couple of free/paid services to run & share Python code online, our focus in this tutorial will be on Azure notebooks powered by Jupyter.

What are Azure notebooks & Jupyter?

As stated on the official documentation, Azure Notebooks is a free service for anyone to develop and run code in their browser using Jupyter. Jupyter is an open source project that enables combing markdown prose, executable code, and graphics onto a single canvas.

Azure Notebooks currently supports Python 2, Python 3, R and F# and their popular packages (e.g for Python the Anaconda distro is preinstalled), but our focus for the moment will be on Python 3 since it’s the minimum required version for the Python SDK

Your first Azure notebooks project

To create your first Azure notebooks project, navigate to the home page
click on Try it now then login (any Microsoft, Gmail,…. email address).

Once successfully logged in, navigate to section My Projects

Click on button New Project :

Introduce a Project name and and ID then click on Create (It’s worth mentioning that you have to set the project as Public if you wish to be able to share your notebooks with other users)

Click on the newly created project :

Notebooks are organized by projects, this makes it very efficient to create separate projects depending on scripts, target hosts and target audience to share notebooks with.

To create a new notebook, click on menu then select Notebook. Add a name for the notebook and select your Python 3 version (either 3.5 or 3.6 as both compatible with the Python SDK)

Notebooks are organized into cells, each cell can contain one or multiple python scripts to execute.

First cell should always be the following one as it’s required to install first pma_python packages on the running server before being able to interact with the Python SDK.

From there on you can add as many cells as you wish to interact with the Python SDK via scripts we introduced on previous posts or ones you create yourself.

Once your notebook modified and saved, you can easily share the created project with other users via share button on My projects page.

The terminal

In addition to its intuitive and easy-to-use interface, Azure notebooks do provide provides access to a complete terminal running on the server. To access the terminal first click on the Jupyter icon in the upper left hand corner of your notebook server. Then click on the New button on the upper right hand side of the notebook list. Finally click Terminal.

Your newly created notebook is accessible on the running server and executing shell commands there which can be useful for downloading data, copying files, inspecting processes, or editing files with traditional Unix tools.

Slide visualization in Python

Now that both PHP and Java have methods for embedded slide visualization, we can’t leave Python out. Originally we didn’t think there would be much need for this, but it’s at least confusing to have certain methods available in one version of our SDK, while not in others.

In addition, interactive visualization is definitely a thing in Python; just have a look at what you can do with Bokeh. Ideally and ultimately, we’d like to add digital pathology capabilities to an already existing framework like Bokeh, but in this blog post we’ll just explore how you can embed a slide into your IPython code as is.

As PMA.python is not a standard library, it bears to start your notebooks with the necessary detection code for the library. If it doesn’t work, it’s bad manners to leave your users in the dark, so we’ll provide some pointers on what needs to be done, too:


try:
    from pma_python import core
    print("PMA.python loaded: " + core.__version__)
except ImportError:
    print("PMA.python not found")
    print("You don't have the PIP PMA.python package installed.\n"
        + "Please obtain the library through 'python -m pip install pma_python'")

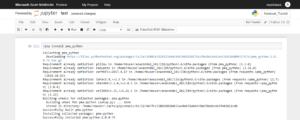
If all goes well, you’ll see something like this:

Once you’re assured the PMA.python library is good to go, you should probably verify that you can connect to your PMA.core instance (which can be PMA.start, too, of course; just leave the username and password out in that case):


server = "http://yourserverhere/pma.core/"
user = "your_username"
pwd = "your_password"
slide = "rootdir/subdir/test.scn"
session = core.connect(server, user, pwd)
if (session):
    print("Successfully connected to " + server + ": " + session)
else:
    print("Unable to connect to PMA.core " + server + ". Did you specify the right credentials?")

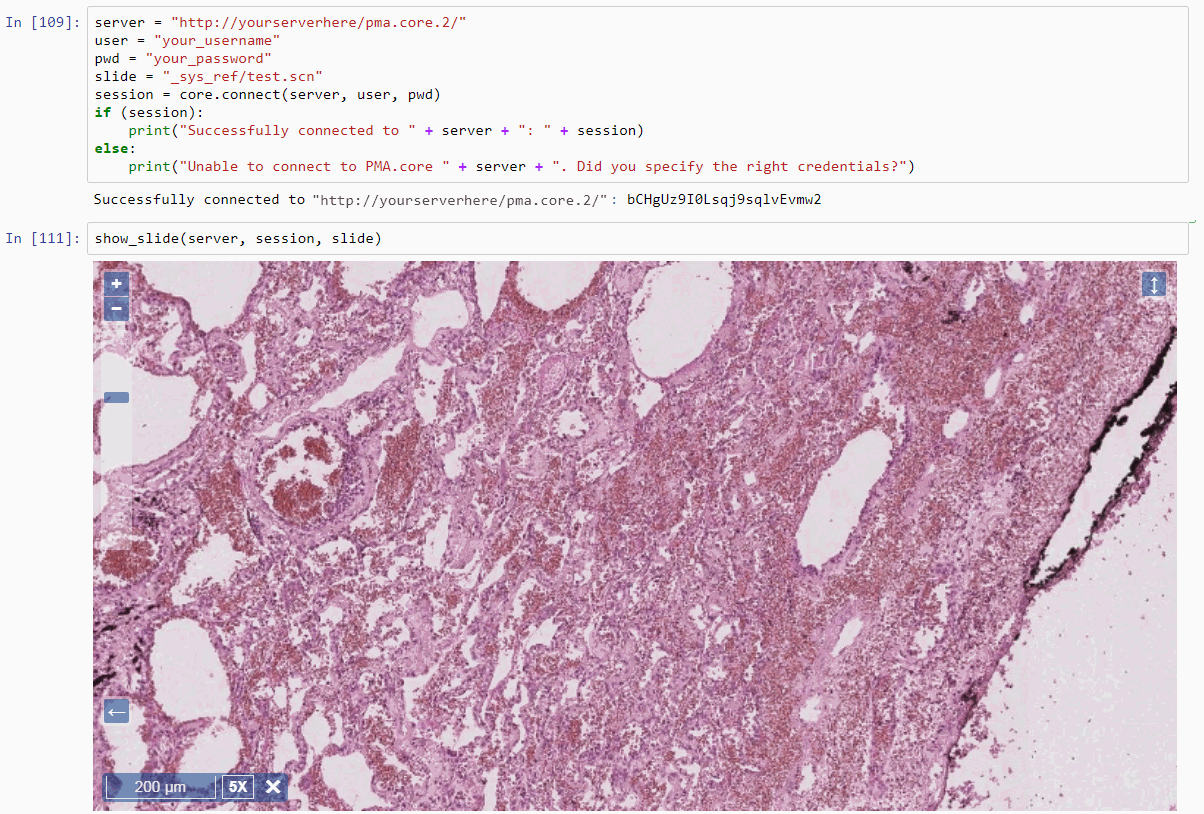
If all goes well, you should get a message that reads like this:

Successfully connected to http://yourserverhere/pma.core

Finally, the visualization part. Note that Pathomation provides a complete front-end Javascript-framework for digital pathology. In order to bring these capabilities into (I)Python then, it sufficient to write some encapsulation code around this basic demonstration code:


def show_slide(server, session, slide):
    try:
        from IPython.core.display import display, HTML
    except ImportError:
        print("Unable to render slide inline. Make sure that you are running this code within IPython")
        return
    
    render = """
        <script src='""" + server + """scripts/pma.ui/pma.ui.view.min.js' type="text/javascript"></script>

<div id="viewer" style="height: 500px;"></div>
<script type="text/javascript">
            // initialize the viewport
            var viewport = new PMA.UI.View.Viewport({
                    caller: "Jupyter",
                    element: "#viewer",
                    image: '""" + slide + """',
                    serverUrls: ['"""+ server + """'],
                    sessionID: '""" + session + """'
                },
                function () {
                    console.log("Success!");
                },
                function () {
                    console.log("Error! Check the console for details.");
                });
        </script>"""
display(HTML(render))

Our method is a bit more bulky than strictly needed; it’s robust in this sense that it makes sure that it is actually running in an IPython environment like Anaconda, and will also provide output to the JavaScript console in case the slide can load for some reason.

Rendering a slide inline within a Python / Jupyter notebook is now trivial (just make sure you ran the cell in which you define the above method, before invoking the following piece of code):


show_slide(server, session, slide)

The result look like this:

There is never an excuse not to use exploratory data analysis to get initial insights in your data. As switching environments, browsers, screens… can be tedious, and notebooks are meant to encapsulate complete experiments, interactive visualization of select whole slide images may just be one more thing you want to include.

The .ipynb file can be downloaded here and used as a starting point in your own work.

By studying the PMA.UI framework, you can learn more about how to further modify and customize your interactive views.

Now, anybody out there who wants to pick up our Bokeh challenge?

blur detection in z-stacks

Z-stacking

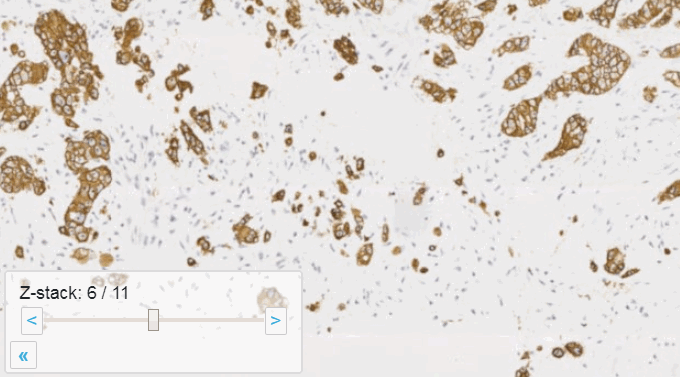
Tissue presented on a glass slide can be obtained in three fashions: tissue slides by a microtome from a FFPE tissue block is typically completely flat. This means a scanner can usually obtain an optimal focus point and scan a large area of tissue in a single pass.

The two other types of samples however are typically not flat: both cytological samples and needle aspirations contain clumps of cell (a pap smear test is a good example); if samples from FFPE tissue blocks are mirror-like surfaces (at least with respect to smoothness), then cytological samples are more like the gravel surface on a tennis court.

Slide scanners can’t decide on a single layer within the tissue to obtain a “one size fits all” focus, so they typically scan a number of sequential planes. This is your z-stack. Pathomation software supports z-stack data from various scanner vendors.
Beyond viewing

Allowing an end-user to navigate through a z-stack is nice, but can be very tedious and time consuming. Imagine that we have a z-stack with 4 images, then each individual layer can look like this:

A skilled pathologist or researcher can scan through a complete slide in under 10 minutes, but it takes time to acquire this skill, and even so: much of that time is still spent zooming in and out, looking for the optimal sharpness in many regions of the slide.

Can we then use an algorithm to at least select out the most out-of-focus and in-focus tiles in a tiled z-stack? Of course the answer is yes (or we wouldn’t be writing about it)!

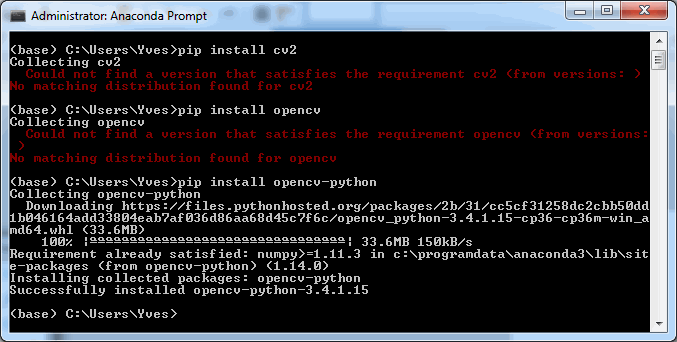
To follow along with the rest of this blog, you’ll need a Jupyter environment (we use Anaconda), a Python programming environment, as well as the PMA_python, Matplotlib, Numpy, and OpenCV packages. You can learn here about setting up PMA_python in Anaconda; take care that you install OpenCV with the correct package name, too (it’s PyPI package name is actually opencv-python, even though you import it into your code as “cv2”):
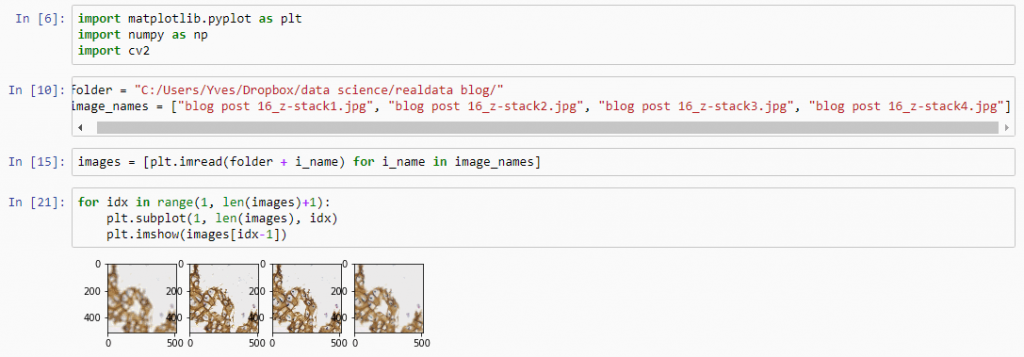
Let’s first see about reading in all images in an array (and visualize them as a sanity check):

import matplotlib.pyplot as plt
import numpy as np
import cv2

folder = "C:/Users/Yves/blog/"
image_names = ["z-stack1.jpg", "z-stack2.jpg", "z-stack3.jpg", "z-stack4.jpg"]

images = [plt.imread(folder + i_name) for i_name in image_names]

for idx in range(1, len(images)+1):   
    plt.subplot(1, len(images), idx)
    plt.imshow(images[idx-1])
Next, let’s apply an OpenCV blurring filter on each image and compute the difference between the pixel-values in the original image and the blurred image.

blur = []
diff = []

for idx in range(0, len(images)):
    blur.append(cv2.blur(images[idx],(5,5)))
    diff.append(np.abs(blur[idx] - images[idx]))

And plot the result (although admittedly visualization of the diff-arrays doesn’t necessarily reveal much information):

for idx in range(0, len(images)):
    plt.subplot(len(images), 3, 1),plt.imshow(images[idx]),plt.title('Original tile ' + str(idx+1))
    plt.xticks([]), plt.yticks([])
    plt.subplot(len(images), 3, 2),plt.imshow(blur[idx]),plt.title('Blurred tile ' + str(idx+1))
    plt.xticks([]), plt.yticks([])
    plt.subplot(len(images), 3, 3),plt.imshow(diff[idx]),plt.title('Difference tile ' + str(idx+1))
    plt.xticks([]), plt.yticks([])
    plt.show()
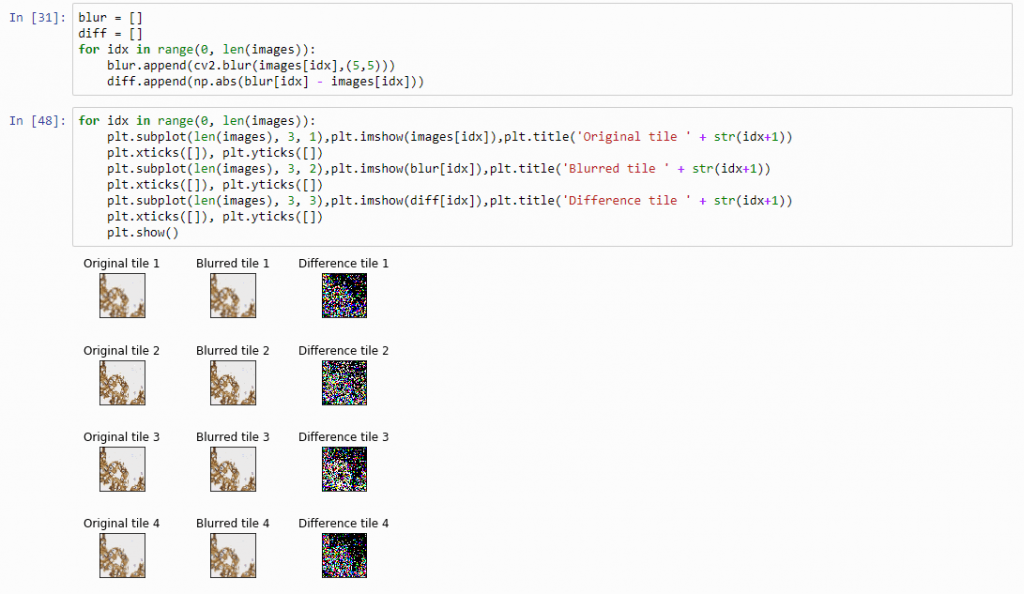
The idea behind our exercise is the following: a blurred image that is blurred, will show less difference in pixel-values, compared to a sharp images that is blurred with the same filter properties.

Therefore, we can now compute the sum of all the values in the diff-array and identify the indices of the lowest and highest values. For our z-stack, the index that contains the smallest summed differences will point to the blurriest (or “most blurred”?) image; the index that contains the largest summed difference will point to the sharpest image. Let’s see if this works:

diff_sums = [np.sum(arr) for arr in diff]

idx_blurriest = diff_values.index(np.min(diff_sums))
idx_sharpest = diff_values.index(np.max(diff_sums))

plt.subplot(121)
plt.imshow(images[idx_blurriest])
plt.title("Blurriest tile")

plt.subplot(122)
plt.imshow(images[idx_sharpest])
plt.title("Sharpest tile")
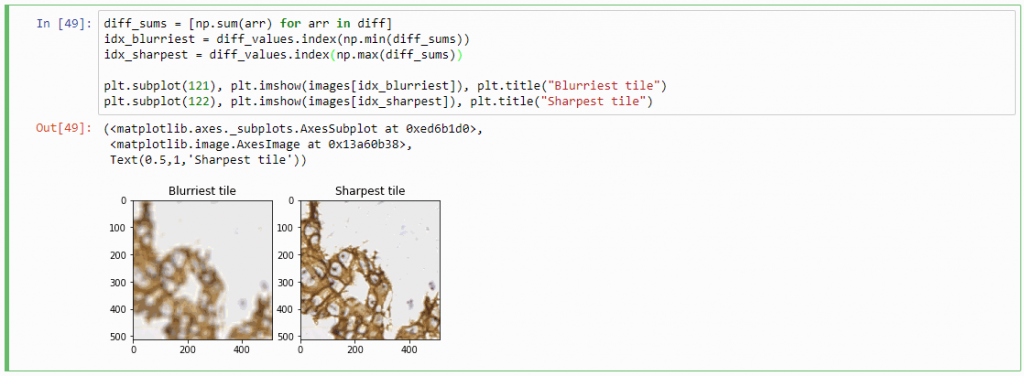
Success! We now have a way to identify the sharpest image in a z-stack, using only free and open source software.

You can download the Jupyter notebook with the code so far here.

Sharpness heatmap

For any z-stacked slide, we can now write a loop that goes over all tiles in the slide. At each location, we retrieve all the z-stacked tiles:

def get_z_stack(path, x, y):
    z_stack = []
    for i in range(0, num_z_stacks):
        # print("getting tile from", path, " at ", x, y, " (zoomlevel", sel_zl, ") / z-stack level ", i)
        z_stack.append(core.get_tile(path, x, y, zoomlevel=sel_zl, zstack=i))
    return z_stack

Now we can calculate at each location independently the sharpest tile.

def determine_sharpest_tile_idx(tiles):
    blur = []
    diff = []

    for idx in range(0, len(tiles)):
        blur.append(cv2.blur(np.array(tiles[idx]),(5,5)))
        diff.append(np.abs(blur[idx] - tiles[idx]))
        diff_sums = [np.sum(arr) for arr in diff]

    return diff_sums.index(np.max(diff_sums))

And we can invoke these method repeatedly for each location in the slide:

zoomlevels = core.get_zoomlevels_dict(slide)
sel_zl = int(round(len(zoomlevels) / 2)) + 2     # arbitrary selection
max_x, max_y = zoomlevels[sel_zl][0], zoomlevels[sel_zl][1]

sharpness_map = []
for x in range(0, max_x):
    print (".", end="")
    for y in range(0, max_y):
        sharpness_map.append(determine_sharpest_tile_idx(get_z_stack(slide, x, y)))

Say that the thumbnail of our image look as follows:
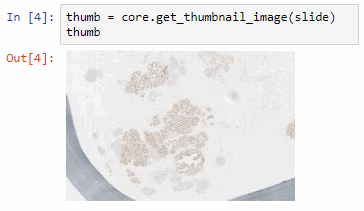
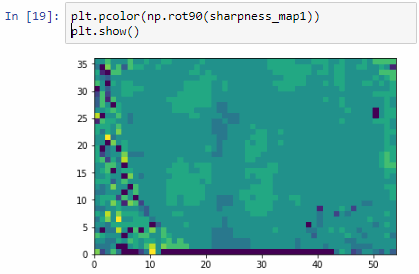
We can then print the selected optimal layers at each position as a heatmap with matplotlib.

The resulting image illustrates the fact that indeed throughout the slide, different clusters of cells are sharper in one plane or another.

The output for one of our slides looks like this:
Constructing a new single-plane image

Instead of returning the index of the sharpest tile in a stack of tiles, we can return the sharpest tiles itself. For this, we only need to make a small modification in our earlier determine_sharpest_tile_idx function.

def determine_sharpest_tile(tiles):
    blur = []
    diff = []

    for idx in range(0, len(tiles)):
        blur.append(cv2.blur(np.array(tiles[idx]),(5,5)))
        diff.append(np.abs(blur[idx] - tiles[idx]))
        diff_sums = [np.sum(arr) for arr in diff]

    return tiles[diff_sums.index(np.max(diff_sums))]

We can subsequently paste all of the sharpest tiles into a new PIL image object that is made up of the dimensions of the selected zoomlevel from which the tiles are selected:

def get_focused_slide(slide, zoomlevel):
    x_count, y_count, n = core.get_number_of_tiles(slide, zoomlevel)
    x_tile_size, y_tile_size = core.get_tile_size()
    focused_tiles = []
 
    image = Image.new('RGB', (x_count * x_tile_size, y_count * y_tile_size))
 
    coords = list(map(lambda x: (x[0], x[1], zoomlevel), itertools.product(range(y_count), range(x_count))))

    for x in range(0, max_x):
        print (".", end="")
        for y in range(0, max_y):
            focused_tiles.append(determine_sharpest_tile_idx(get_z_stack(slide, x, y)))

    i=0
    for y in range(y_count):
        for x in range(x_count):
            tile = focused_tiles[i]
            i+=1
            image.paste(tile, (x*x_tile_size, y*y_tile_size))

    return image

If you’ve run the code so far, you’ve already found out (the hard way) that it can actually take quite some time to loop over all tiles in the slide this way.

Therefore, let’s introduce some parallellization logic here as well:

def get_focused_tile(c):
    return determine_sharpest_tile(get_z_stack(slide, c[1], c[0], c[2]))

def get_focused_slide(slide, zoomlevel):
    x_count, y_count, n = core.get_number_of_tiles(slide, zoomlevel)
    x_tile_size, y_tile_size = core.get_tile_size()
    focused_tiles = []
 
    image = Image.new('RGB', (x_count * x_tile_size, y_count * y_tile_size))
 
    coords = list(map(lambda x: (x[0], x[1], zoomlevel), itertools.product(range(y_count), range(x_count))))

    tiles = Parallel(n_jobs=-1, verbose=2, backend="threading")(
        map(delayed(get_focused_tile), tqdm(coords)))
 
    i=0
    for y in range(y_count):
        for x in range(x_count):
            tile = tiles[i]
            i+=1
            image.paste(tile, (x*x_tile_size, y*y_tile_size))

    return image

Once you have the new image, saving the image to TIFF output is trivial:

image = get_focused_slide(slide, 6)    # do this at zoomlevel 6, can take a while...
image.save('focused_image.tiff')

Which in practice can end up looking like this (including parallellization progression bars):
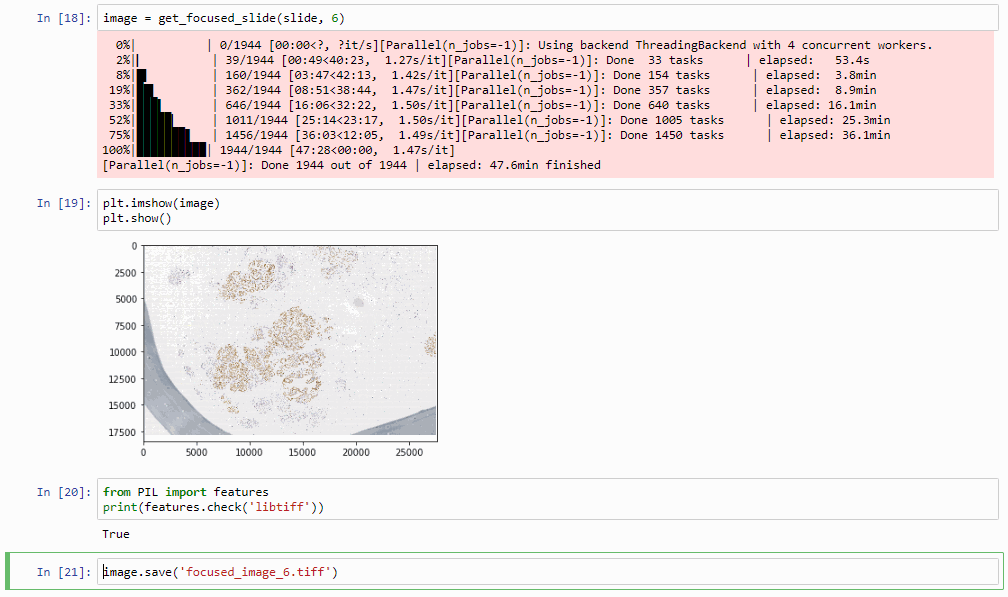
The resulting image can now be opened in turn (in PMA.start, of course) to navigate without the need to continuously having to scan for the sharpest plane.

Here’s comparison of a random zoomlevel in the original image with the same region of interest in the new optimized image:

The sourcecode for this procedure so far can be downloaded as another Jupyter notebook (thanks Oleg Kulaev for helping with the finer details of parallellization and image orientation handling in matplotlib).

Cool huh? Well, sort of, kinda… read on.

Libvips to save our TIFFs

There’s an implicit problem with the TIFFs that we generate: they’re big! Most importantly… they’re flat.

There’s some irony to this. We spent all this effort flattening the z-stacked CZI file for a flat TIFF, which is infinitely slower to navigate than the original CZI!

So saving as a pyramidal TIFF instead of a flat tiff would definitely help our case here.

The quickest way to do this is through libvips, with pyvips bindings installed (make sure that you install libvips before getting pyvips with pip; also, if you’re on Windows, make sure that the libvips’ \bin folder is included in your SYSTEM path variable).

Our final step therefore is getting our “flat” PIL image object to a pyramidal tiff (if you need to freshen up about why the pyramid exists in these files, see our section on Whole Slide Images and pyramid stacks in https://realdata.pathomation.com/digital-microscopy-imaging-data-with-python/)

import pyvips

dtype_to_format = {
 'uint8': 'uchar',
 'int8': 'char',
 'uint16': 'ushort',
 'int16': 'short',
 'uint32': 'uint',
 'int32': 'int',
 'float32': 'float',
 'float64': 'double',
 'complex64': 'complex',
 'complex128': 'dpcomplex',
}

img_3d_array = np.asarray(image)
height, width, bands = img_3d_array.shape
linear = img_3d_array.reshape(width * height * bands)
pyvips_image = pyvips.Image.new_from_memory(linear, width, height, bands, dtype_to_format[str(img_3d_array.dtype)])

tile_width, tile_height = core.get_tile_size()
pyvips_image.write_to_file('pyramidal_image.tiff', tile=True, tile_width=tile_width, tile_height=tile_height, pyramid=True)

This final procedure is available as yet another separate Jupyter notebook. Once again much gratitude goes to Oleg Kulaev for figuring out the libvips interactions.

Curious about how to identify blurry tiles in single plane brightfield images? We have a post about that, too.

Optimization

The procedure as described can still take quite a while to process. The time needed is highly dependent on the selected zoomlevel. Deeper zoomlevels give you better accuracy, but at the expense of having to process more pixels.

We wrote this post mostly to explain the principle of how blur detection and z-stack optimization can work. By no means do we claim that is production-ready code. If you need professional, scalable blur-detection methods, check out e.g. David Ameisen‘s start-up company ImginIT (just don’t expect his process to be as clearly explained as we just did).

Here are a couple of ideas for optimization:

  • Do we really need to consider all pixels in a tile? Can we get by with selecting perhaps every other 2nd, 4th, 8th… pixel perhaps?
  • Do we need to run the blur detection on tiles from zoomlevel x in order to determine the right layer to select from? Perhaps we can get by with zoomlevel x – 1, x – 2…
  • Do we need to process tiles in their entirety? Perhaps we can select tiles from a coarser zoomlevel, artificially break up an individual tiles in smaller tiles, and use those as a reference.
  • Last but not least, do we even need all contingent tiles? This is easiest to illustrate in a 1-dimensional world: if the optimal layer to select from for tile 1 and tile 3 are the same, is there still any point to examine tile 2 as well? It’s easy now to conceive a recursive algorithm that starts with a (possibly even random) selection of tiles that only analyzes intermediate tiles as the need arises.

In a next post we’ll be discussing how you can use PMA.start to generate DICOM-compliant image objects.

Working with digital microscopy imaging data using our Python SDK

Representation

PMA.start is a free desktop viewer for whole slide images. In our previous post, we introduced you to pma_python, a novel package that serves as a wrapper-library and helps interface with PMA.start’s back-end API.

The images PMA.start typically deals with are called whole slide images, so how about we show some pixels? As it turns out, this is really easy. Just invoke the show_slide() call. Assuming you have a slide at c:\my_slides\alk_stain.mrxs, we get:

from pma_python import core
slide =  "C:/my_slides/alk_stain.mrxs"
core.show_slide (slide)

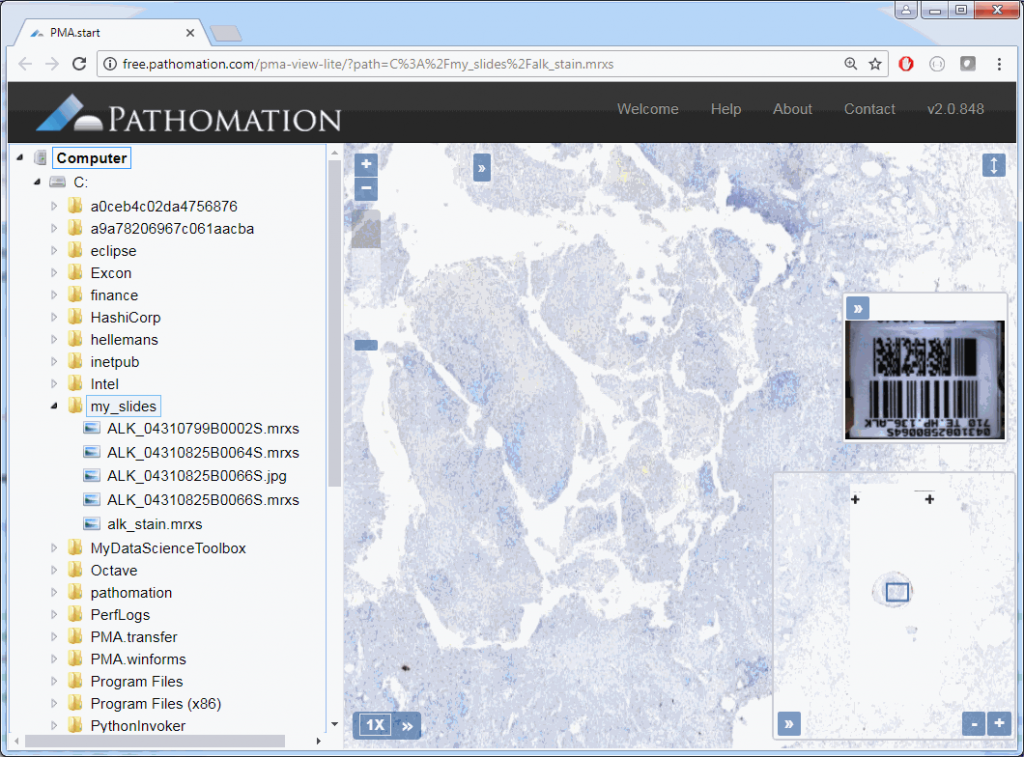
The result depends on whether you’re using PMA.start or a full version of PMA.core. If you’re using PMA.start, you’re taken to the desktop viewer:

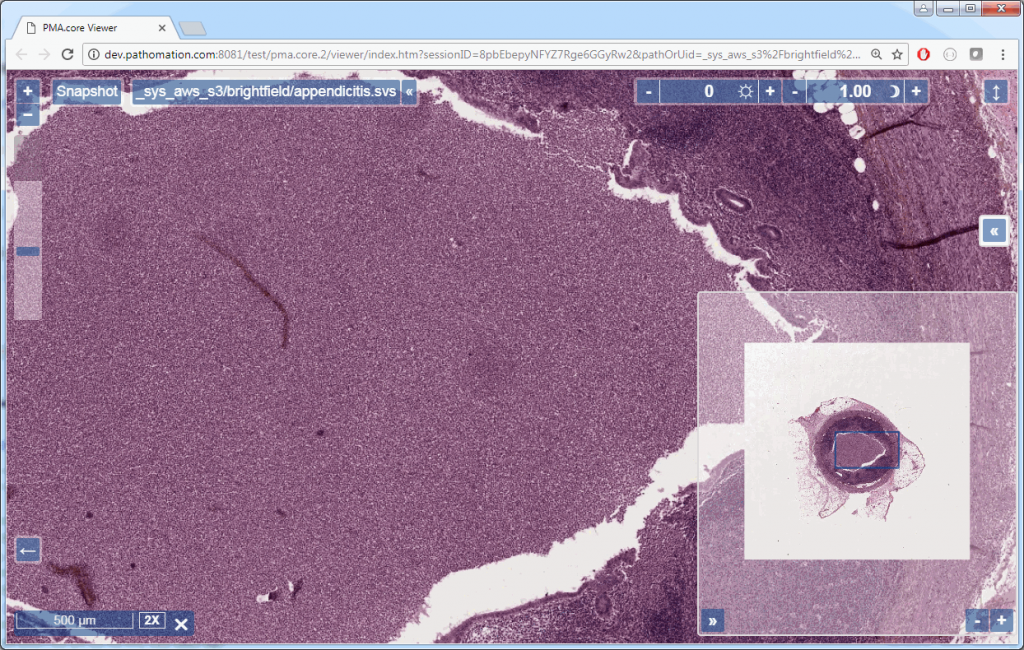
If you’re using PMA.core, you’re presented with an interface with less frills: the webbrowser is still involved, but nothing more than scaffolding code around a PMA.UI.View.Viewport is offered (which actually allows for more powerful applications):

Associated images

But there’s more to these images; if you only wanted to view a slide, you wouldn’t bother with Python in the first place. So let’s see what else we can get out of these?

Assuming you have a slide at c:\my_slides\alk_stain.mrxs, you can execute the following code to obtain a thumbnail image representing the whole slide:

from pma_python import pma
slide =  "C:/my_slides/alk_stain.mrxs"
thumb = core.get_thumbnail_image(slide)
thumb.show()

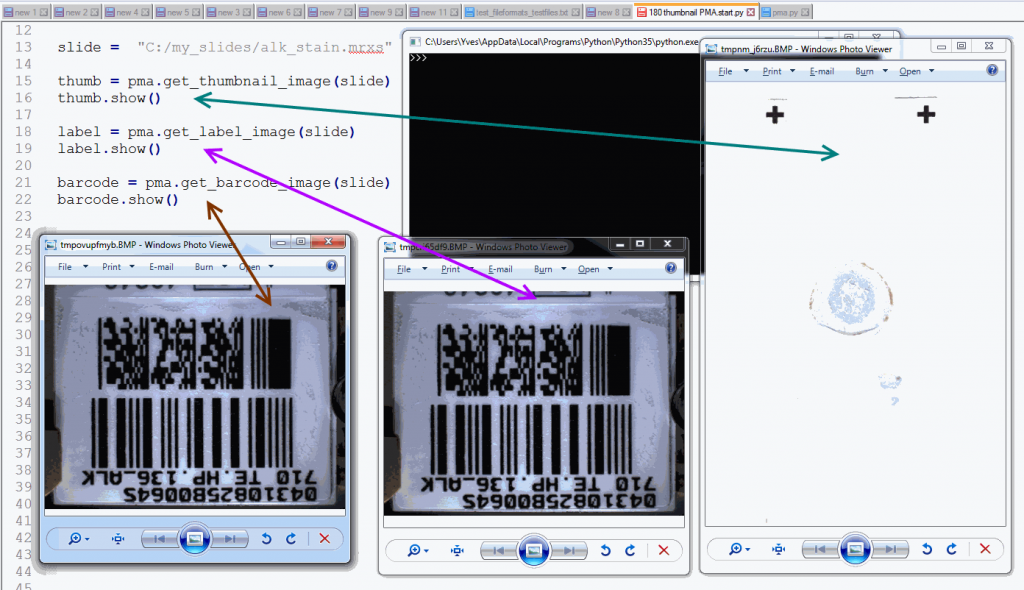
But this thumbnail presentation alone doesn’t give you the whole picture. You should know that a physical glass slide usually consists of two parts: the biggest part of the slide contains the specimen of interest and is represented by the thumbnail image. However, near the end, a label is usually pasted on with information about the slide: the stain used, the tissue type, perhaps even the name of the physician. More recently, oftentimes the label has a barcode printed on it, for easy and automated identification of a slide. The label is therefore sometimes also referred to as “barcode”. Because the two terms are used so interchangeably, we decided to support them in both forms, too. This makes it easier to write code that not only syntactically makes sense, but also applies semantically in your work-environment.

A systematic representation of a physical glass slide can then be given as follows:

The pma_python library then has three methods to obtain slide representations, two of which are aliases of one another:

core.get_thumbnail_image() returns the thumbnail image

core.get_label_image() returns the label image

core.get_barcode_image() is an alias for get_label_image

All of the above methods return PIL Image-objects. It actually took some discussion to figure out how to package the data. Since the SDK wraps around an HTTP-based API, we settled on representing pixels through Pillows. Pillows is the successor to the Python Image Library (PIL). The package should be installed for you automatically when you obtained pma_python.

The following code shows all three representations of a slide side by side:

from pma_python import core
slide =  "C:/my_slides/alk_stain.mrxs"
thumb = core.get_thumbnail_image(slide)
thumb.show()
label = core.get_label_image(slide)
label.show()
barcode = core.get_barcode_image(slide)
barcode.show()

The output is as follows:

Note that not all WSI files have label / barcode information in them. In order to determine what kind of associated images there are, you can inspect a SlideInfo dictionary first to see what’s available:

info = core.get_slide_info(slide)
print(info["AssociatedImageTypes"])

AssociatedImageTypes may refer to more than thumbnail or barcode images, depending on the underlying file format. The most common use of this function is to determine whether a barcode is included or not.

You could write your own function to determine whether your slide has a barcode image:

def slide_has_barcode(slide):
    info = core.get_slide_info(slide)
    return "Barcode" in info["AssociatedImageTypes"]

Tiles in PMA.start

We can access individual tiles within the tiled stack using PMA.start, but before we do that we should first look some more at a slide’s metadata.

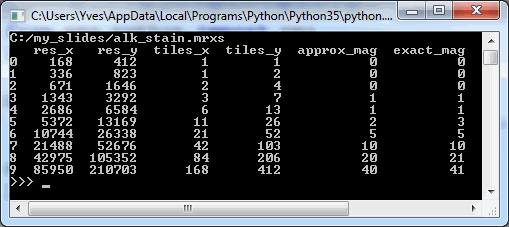
We can start by making a table of all zoomlevels the tiles per zoomlevel, along with the magnification represented at each zoomlevel:

from pma_python import pma
import pandas as pd

level_infos = []
slide = "C:/my_slides/alk_stain.mrxs"
levels = core.get_zoomlevels_list(slide)
for lvl in levels:
    res_x, res_y = core.get_pixel_dimensions(slide, zoomlevel = lvl)
    tiles_xyz = core.get_number_of_tiles(slide, zoomlevel = lvl)         
    dict = {
        "res_x": round(res_x),
        "res_y": round(res_y),
        "tiles_x": tiles_xyz[0],
        "tiles_y": tiles_xyz[1],
        "approx_mag": core.get_magnification(slide, exact = False, zoomlevel = lvl),
        "exact_mag": core.get_magnification(slide, exact = True, zoomlevel = lvl)
     }
     level_infos.append(dict)

df_levels = pd.DataFrame(level_infos, columns=["res_x", "res_y", "tiles_x", "tiles_y", "approx_mag", "exact_mag"])
print(slide)
print(df_levels)

The result for our alk_stain.mrxs slide looks as follows:

Now that we have an idea of the number of zoomlevels to expect and how many tiles there are at each zoomlevel, we can request an individual tile easily. Let’s say that we wanted to request the middle tile at the middle zoomlevel:

slide = "C:/my_slides/alk_stain.mrxs"
levels = core.get_zoomlevels_list(slide)
lvl = levels[round(len(levels) / 2)]
tiles_xyz = core.get_number_of_tiles(slide, zoomlevel = lvl)         
x = round(tiles_xyz[0] / 2)
y = round(tiles_xyz[1] / 2)
tile = core.get_tile(slide, x = x, y = y, zoomlevel = lvl)
tile.show()

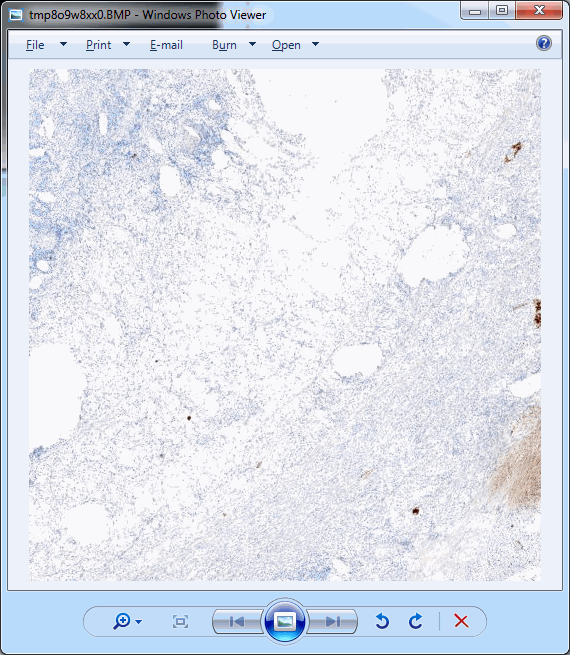
This should pop up a single tile:

.Ok, perhaps not that impressive.

In practice, you’ll typically want to loop over all tiles in a particular zoomlevel. The following code will show all tiles at zoomlevel 1 (increase to max_zoomlevel at your own peril):

tile_sz = core.get_number_of_tiles(slide, zoomlevel = 1) # zoomlevel 1
for xTile in range(0, tile_sz[0]):
    for yTile in range(0, tile_sz[1]):
        tile = core.get_tile(slide, x = xTile, y = yTile, zoomlevel = 1)
        tile.show()

The advantage of this approach is that you have control over the direction in which tiles are processed. You can also process row by row and perhaps print a status update after each row is processed.

However, if all you care about is to process all rows left to right, top to bottom, you can opt for a more condensed approach:

for tile in core.get_tiles(slide, toX = tile_sz[0], toY = tile_sz[1], zoomlevel = 4):
    data = numpy.array(tile)

The body of the for-loop now processes all tiles at zoomlevel 4 one by one and converts them into a numpy array, ready for image processing to occur, e.g. through opencv. But that will have to wait for another post.