The story of the three Qs
In this article, we explain how Pathomation was recently able to assist its one of its customers with Performance Qualification tests for a new slide scanner.
At our customer’s lab, each piece of equipment that they take into operation, goes through a rigorous qualification pipeline before putting it to work for day-to-day lab activities.
This goes for slide scanners as well.
The qualification pipeline (the “validation procedure”) consists of three steps:
- Installation Qualification (IQ)
- Operational Qualification (OQ)
- Performance Qualification (PQ)
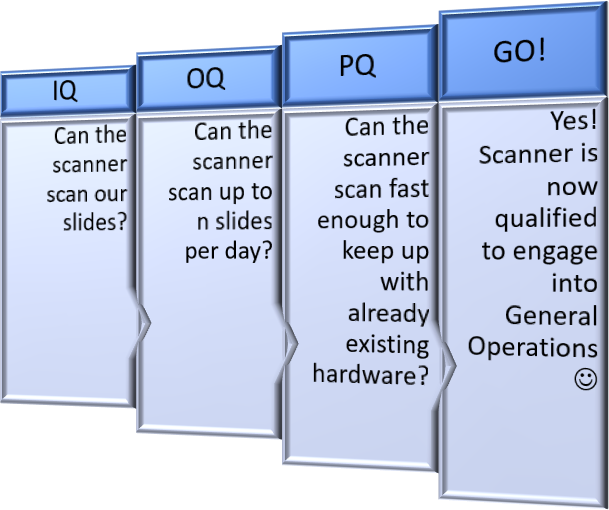
The first step is straightforward: you’re asking yourself if the scanner can scan your slides or not. Is the type of glass slide that your lab use, in combination with the coverslip, compatible with the new scanner? Is the barcode on the slide label scanned properly, too? What about (automated) tissue detection?…
The second step is operational qualification: can the new equipment handle the edge parameters of your day-to-day operations? If you plan to feed the scanner up to 400 slides per day; will that work?
The third step in the validation can be somewhat subjective, and it’s here that Pathomation’s software platform came in particularly handy.
Performance Qualification
Performance Qualification (PQ) is a test procedure that takes place in order to verify if a new piece of equipment is good enough to be put to work in the daily workflow of a company. It happens after the hardware has already gone through IQ and OQ.
Our customer recently wanted to know how their various scanners compare to a new one in terms of speed. They took a representative set of slides, divided it in three groups (“requests”), and then put each scanner to work.
their various scanners compare to a new one in terms of speed. They took a representative set of slides, divided it in three groups (“requests”), and then put each scanner to work.
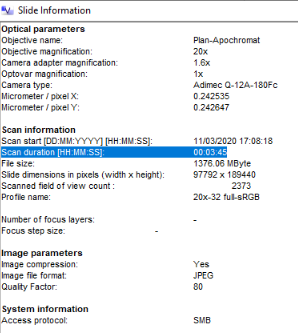
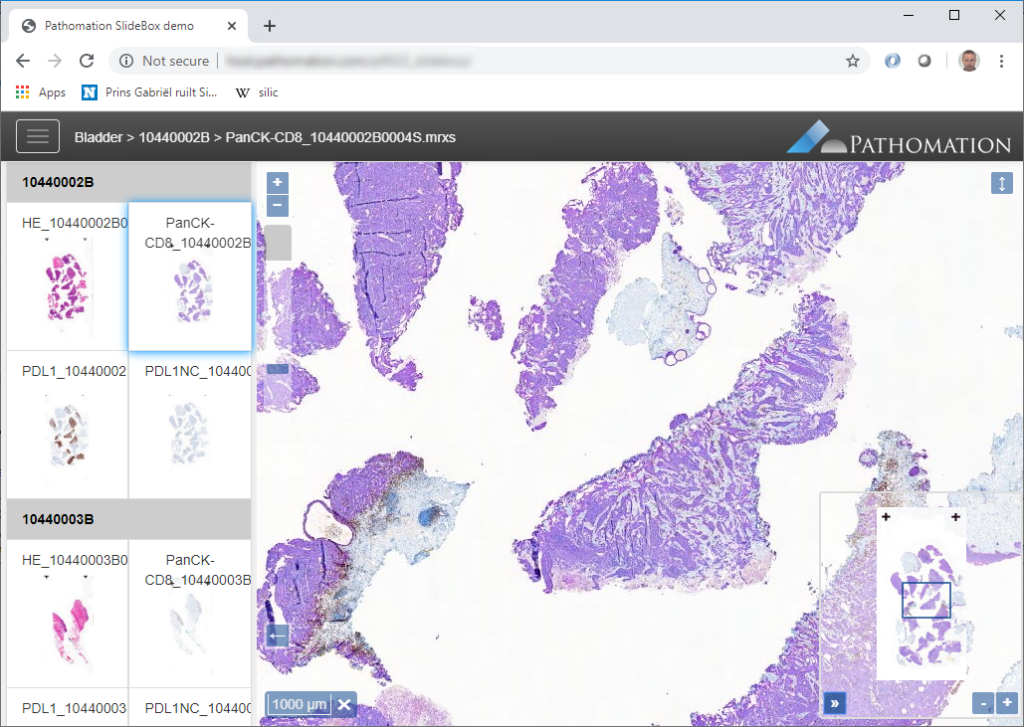
In the vendor’s viewer software, one of the parameters that could be seen was “scanning duration”. Considering the side of the dataset however, opening each slide individually in the viewer software, noting down the scanning time, recording it into an Excel sheet etc., would have been a very tedious task.
So they turned to Pathomation for help: Can Pathomation’s software be used to create a table with all scan duration values for all scanned slides?
Our API
Pathomation’s API offers a get_slide_info() call. We used it in our first article on business intelligence to extract specific bits of information with it. The method be default returns a nested hierarchy of information.
But not every scanner exports the same information. Some of the slide information we expose ourselves through ImageInfo, some not. This is because vendor 1 exposes (A, B, C, D, E), vendor 2 exposes (A, B, F, G, H), vendor 3 exposes (A, B, C, I, J, K, L) etc. Therefore, Pathomation offers the common denominator information only, something like (A, B, C).
In order to maintain some standardization across the different vendors, part of the returned information by get_slide_info is a MetaData array that contains key-value pairs that may or may not be provided by your scanner vendor.
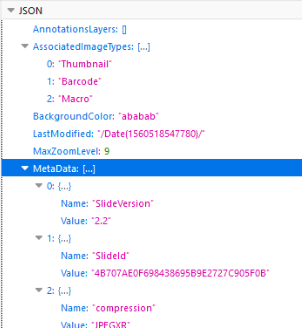
As it turns out, we didn’t have the scanning time in there yet, but because of the already provided structure, it was straightforward to add it.
Like our first business intelligence exercise, we then write a wrapper method to extract the scanning duration as we need it:
def get_scanning_duration(slide_ref):
    info = core.get_slide_info(slide)
    meta = info["MetaData"]
    for meta_el in meta:
        if (meta_el["Name"] == "ScanningDuration"):
            return meta_el["Value"]
    return -1
The remainder of the script is straightforward:
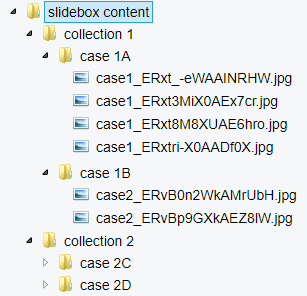
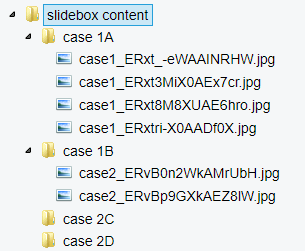
- Loop over the different scanner output
- Foreach scanner (“request”), get all the slides (recursively
in our case)
- Foreach slide, extract the scanning duration
- Foreach scanner (“request”), get all the slides (recursively
in our case)
- Wrap all output into a Pandas dataframe structure
- Export the Dataframe to a spreadsheet
A word about that last step. On occasion, people have called us old-fashioned for this one. Surely Excel is spread wide and far enough by now so that it can be considered a de facto “standard” file format, too, can’t it?
I disagree. I still prefer to use csv instead of Excel. Why? Because csv files are simple, and transportable to many other platforms and applications. Our data in this case consists of a single table with three columns. It’s simple. We don’t need a complex data format to store this kind of data.
Generating fancy file format output is not part of the assignment here. Keep It Simple.
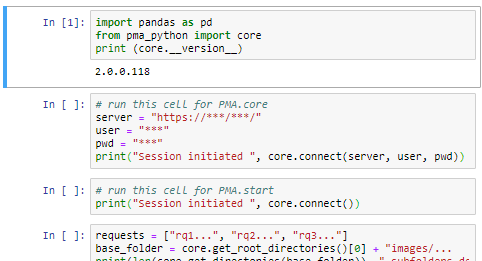
Our final code looks like this and can be downloaded as a Jupyter notebook, so you can play around with it yourself.
server = "http://***/***"
user = "***"
pwd = "***"
print("Session initiated ", core.connect(server, user, pwd))
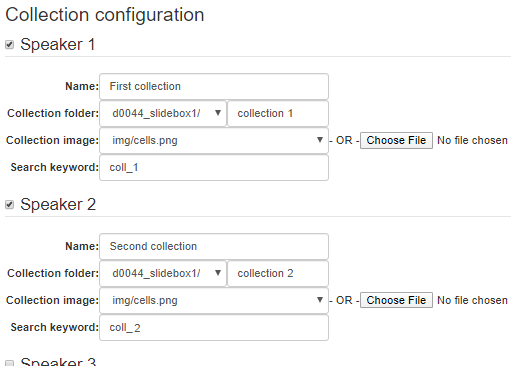
requests = ["RQ105", "RQ204", "RQ695"]
base_folder = " Images/pq"
print(len(core.get_directories(base_folder)), " subfolders detected in root base folder", base_folder)
s_times = []
for req in requests:
print(base_folder + "/" + req)
for slide in core.get_slides(base_folder + "/" + req, recursive=True):
s_times.append({"slide": str(slide).replace(base_folder, ""), "scan_time": get_scanning_duration(slide), "request": str(req)})
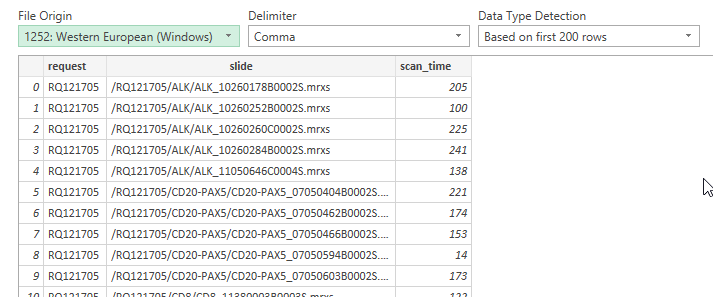
scan_times = pd.DataFrame(s_times, columns=["request", "slide", "scan_time"])
scan_times.to_csv("scanning duration.csv")
What about the results?
We can import the resulting CSV file in Excel and see what it looks like:
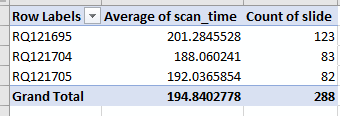
As we’re interested in comparing the different scanners to one another, one direct way to do this is with a pivot-chart.
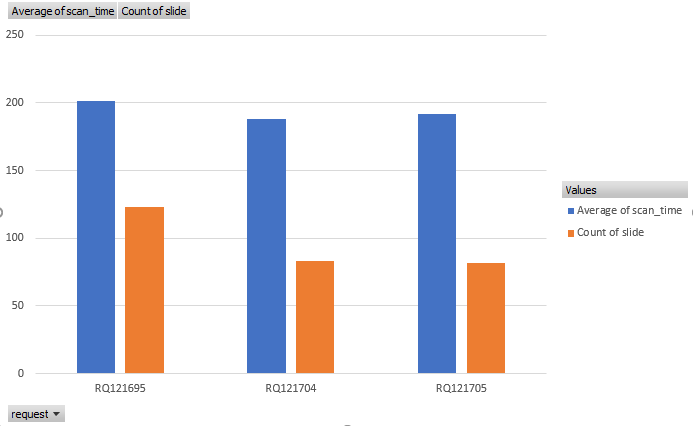
These are the results. What do you think? Do all three scanners perform equally? Does the new scanner pass performance qualification (PQ)?
Your challenge here
This is how Pathomation works with its customers.
Our philosophy has been and remains to develop local, and then scale as you handle more complex scenarios. You do not need the commercial version of PMA.core to get to work with the code in this post. The Jupyter notebook that comes with this blog post is suited for use for both PMA.start and PMA.core.
Do you use Pathomation software in your daily workflows already? Tell us your business intelligence challenge and perhaps we’ll address is in an upcoming post!