The edX track that I’m currently following is sponsored by Microsoft. No particular reason. There are many distance learning options out there, and the combination of MIT, Harvard, and Microsoft seemed like reasonable credentials.
But courses are only as good as to the extent that you can apply them. So let’s see if I actually learned something useful so far.
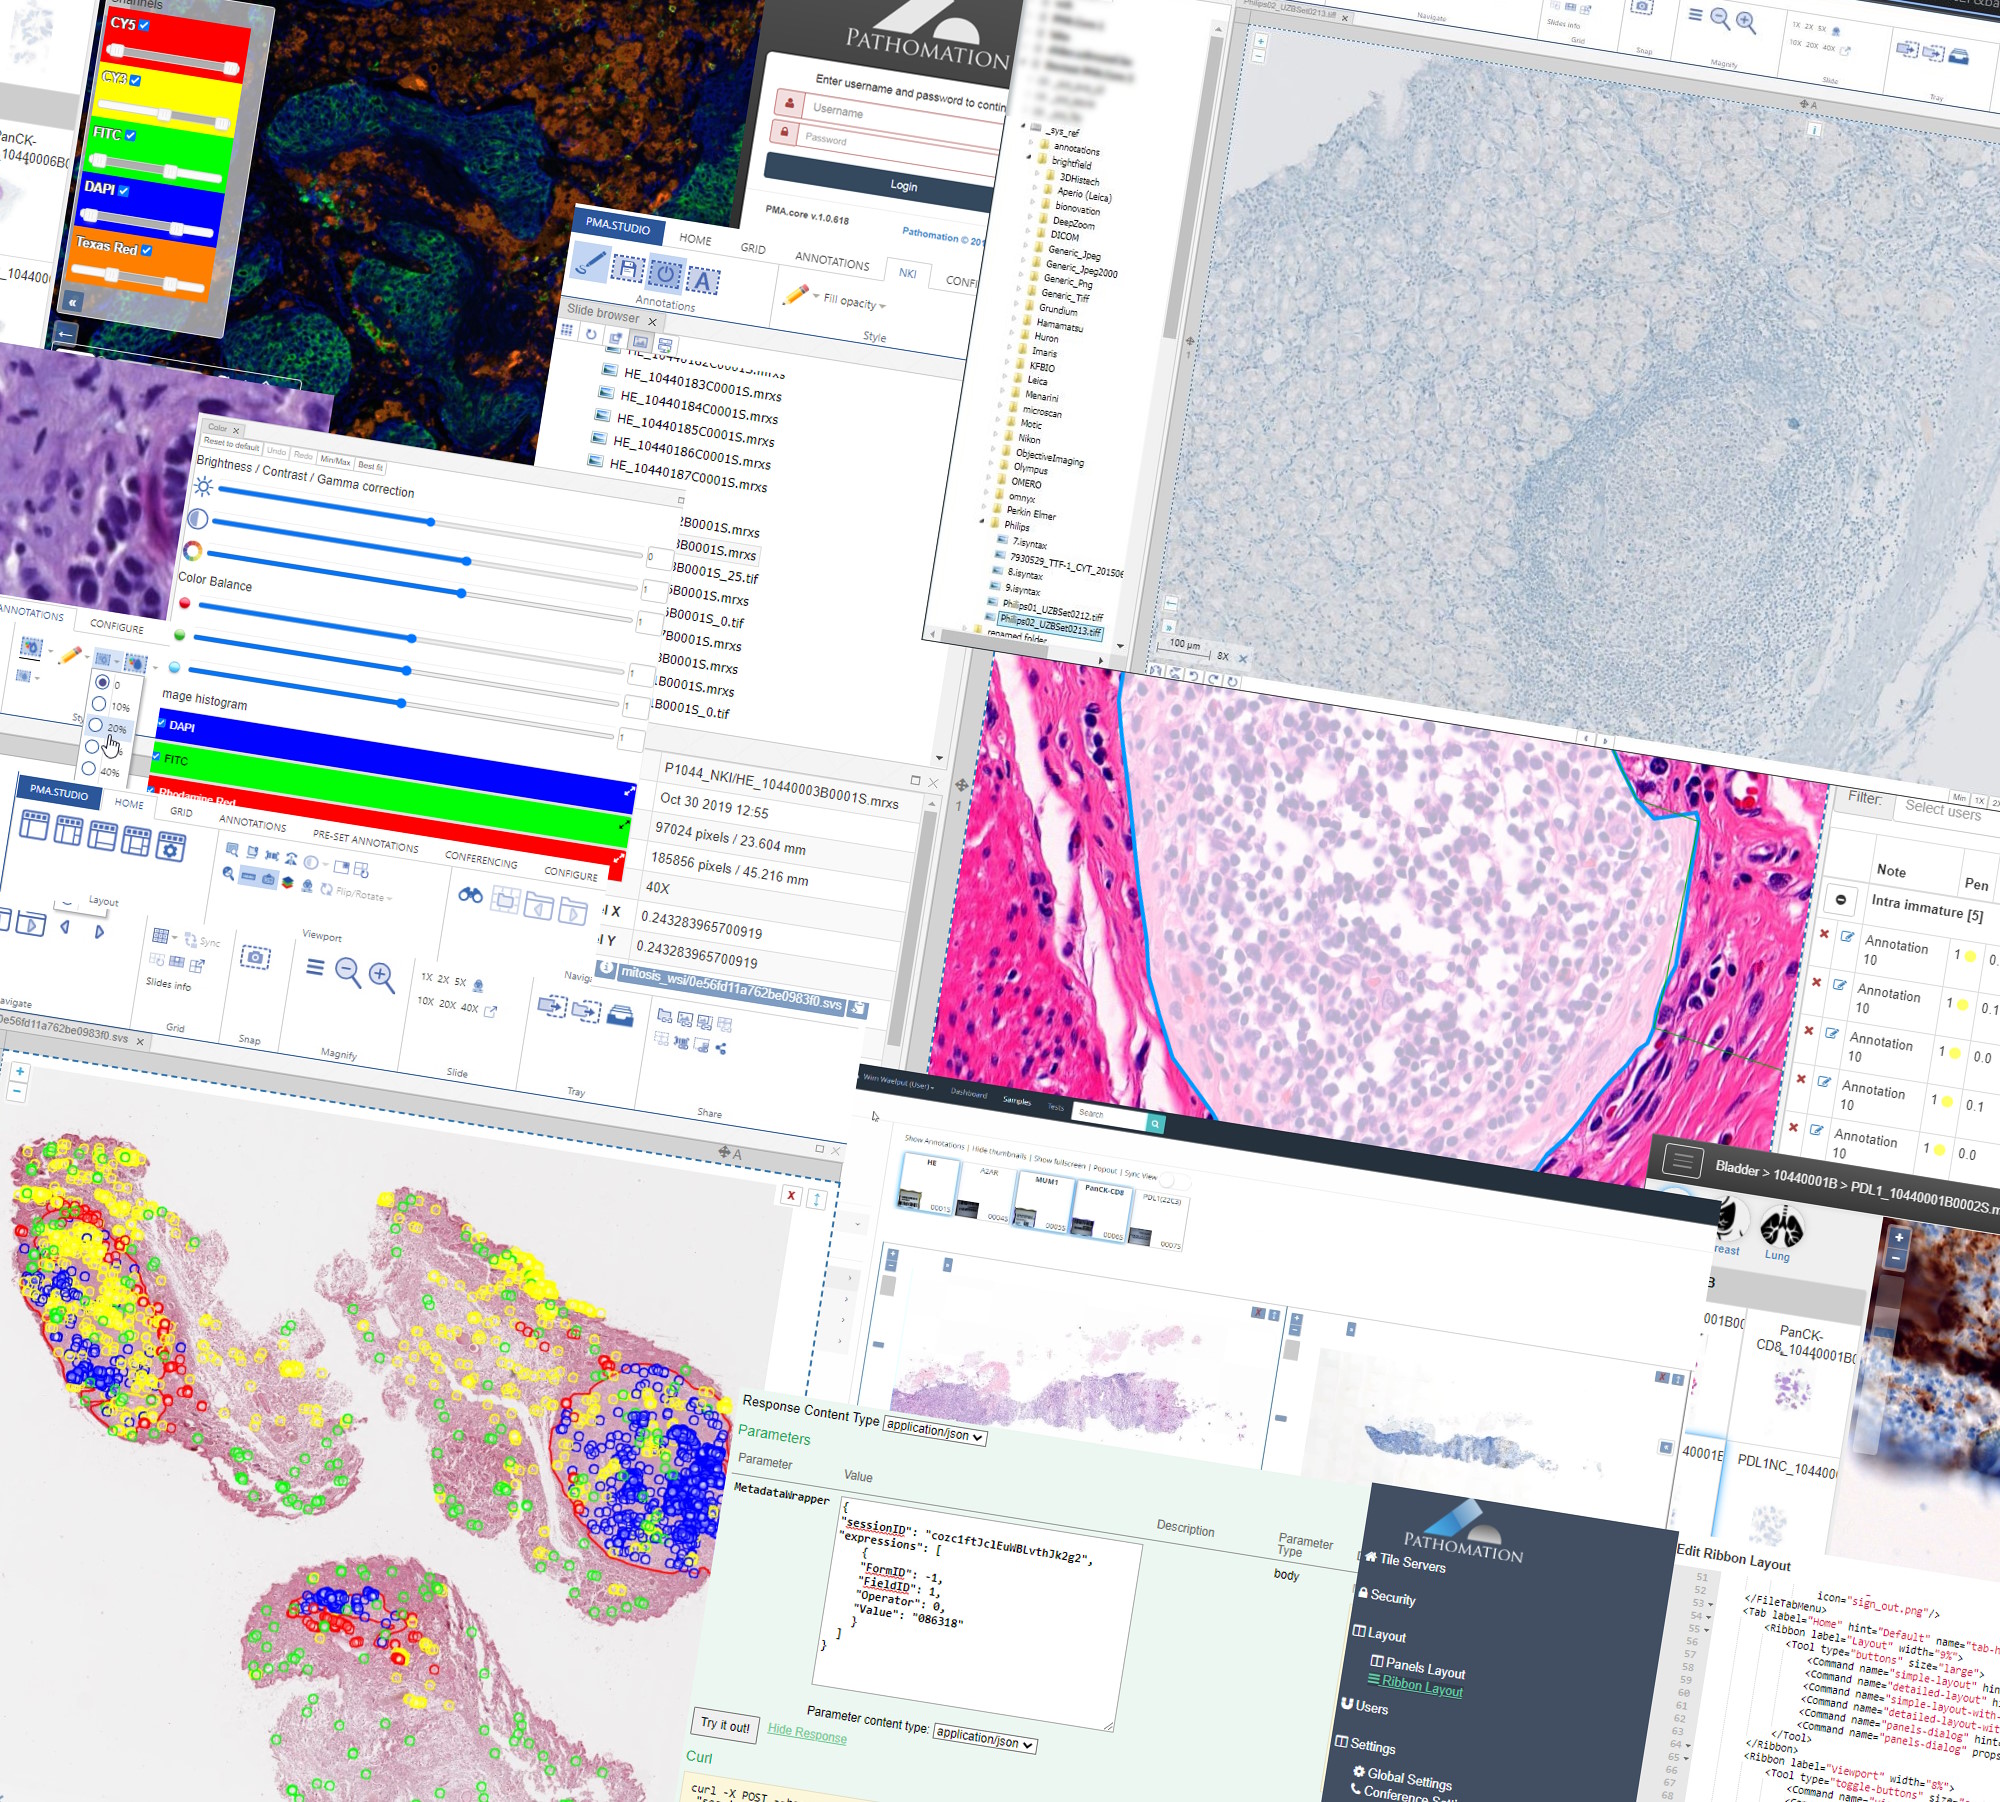
The start-up which I’m involved in, Pathomation, has developed software for digital microscopy (and by extension also pathology and histology). This software is used at the Free Brussels University (VUB).
As part of my job as the VUB’s digital pathology manager, we built an interactive web-portal portal for their diabetes biobank.
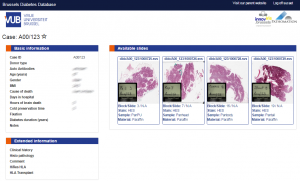
Long story short: now that we have (some of the) data online, we want to go further and integrate with the back-end.
The thesis is simple: for workflow and sample tracking, the laboratory uses SLims (a Biobank Information Management Systems) by Genohm. It is on this end that Pathomation now also wants to offer slide visualization services.
In order to do that, Genohm has asked for a test-set. The test-set should contain sample information, in addition to what slides are associated with each sample. The sample information is contained within a Microsoft SQLServer database, and the slides are hosted within Pathomation’s PMA.core.
A few weeks ago, I would have messed around with Microsoft Excel (or Open Office Calc), but I recently learned about the really cool “data merge” capabilities in Azure ML Studio.
So the plan consists of three steps:
- Extract the sample information from Microsoft SQLServer
- Write a script that lists the slides per sample in Pathomation’s PMA.core
- Use Azure ML Studio to merge both datasets
Here’s the SQLServer query:
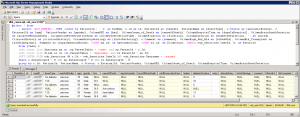
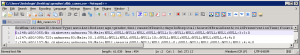
Which after exporting to text still leads a bit of tweaking (SQLServer apparently didn’t include the column names):
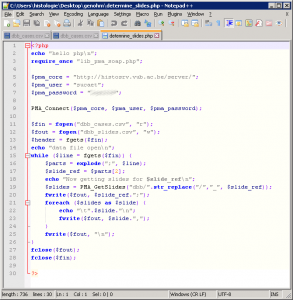
And here’s the PHP script that retrieves the hosted slides from PMA.core:
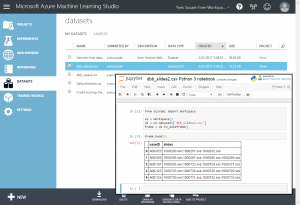
Next, I uploaded both outputs as new datasets into Azure ML Studio (make sure that you use the “,” (comma) as a separator character; Azure ML only operates on CSV files that a (true to their name) COMMA separated):
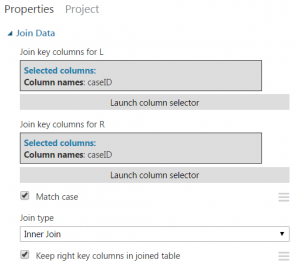
And then I created an experiment that joins both datasets:

Based on a common Sample identifier:
The final step is to extract the new combined dataset:
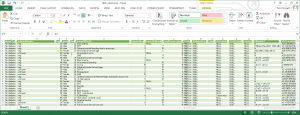
Note that the final field is now a delimited list in its own right (but those were the customer requirements: a single CSV file with one row representing one sample, and a single field in which all (many) slide references were contained).
And there you have it. Admittedly this is not the fanciest data science project ever done, but it still shows how you can very elegantly solve everyday problems. Problems that only a few weeks ago would have been much more complicated for me to solve (What scripting language to use? Use a database or spreadsheet? Etc.)
By the way, it is not my intent to tout Microsoft technology in this blog. I could have looked for another track. I could have gone for Datacamp as an alternative. But my problem with Datacamp is that it seems to have their starting point somewhat wrong: it’s very programming language focused. You either decide you want to do data science with R, or with Python, and that’s it. And once you’re in that track, you’re stuck with the libraries they’re offering you on that platform in that language. Rather myopic, if you ask me. Plus I’ve always never liked R, and don’t know much about Python besides the few scripts that I had the developers at Pathomation write for me. I know one thing: throughout my career I’ve written code in any number of programming languages now, and I find it best to pick the language based on the problem you’re trying to solve, not the other way around. But I digress…
Regardless; I’m really excited about Azure ML Studio. It’s not only a way to do machine learning, but appears to be a versatile toolkit for data handling.
So, do you agree with my approach? Or did I overcomplicate things? Would you have done this differently? Leave a comment below.